One of the most important features of the Graphina plugin is that it can be a time-saver, due to the import function.
Below is a table with the Features and the plans that include them:
Features Free V/S Pro
Loading..........
The Data is Not Available
Charts Library
There are 15+ chart types available in the Graphina Library, optimized to address your data visualization needs, split into the Free Version and Pro Version, including:
- the popular DataTables library
- 9 Google charts
- 6 Data sources
Charts of the Free Version
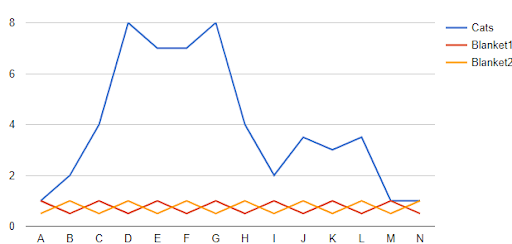
Area: Displays tips when hovering over points (change image)

Here is a dedicated documentation about the Area Chart.
Radial: Radial Bar Charts are valuable in showing comparisons between categories by using circularly shaped bars. (Change image)
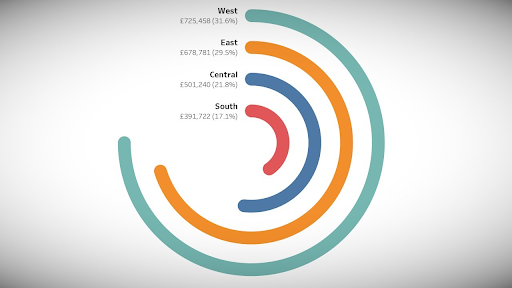
Here is a dedicated documentation about the Radial Chart.
Column: displays tooltips when the user hovers over the data. (Change image)
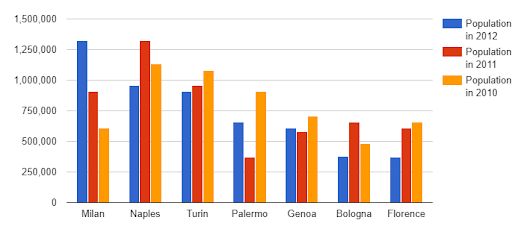
Here is a dedicated documentation about the Column Chart.
Pie: shows the relational proportions between data.
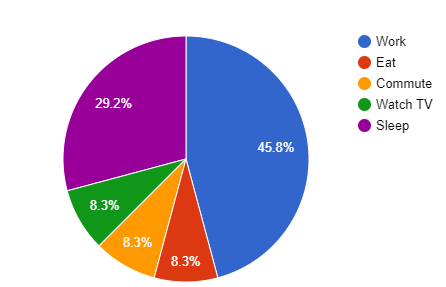
Donut: show the proportions of categorical data, with the size of each piece representing the proportion of each category.
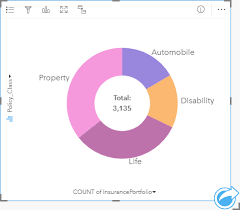
Here is a dedicated documentation about the Donut Chart.
Radar: Shows multiple data points and the variation between them.
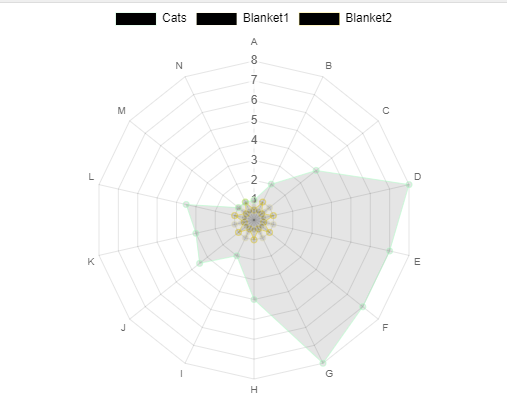
Here is a dedicated documentation about the Radar Chart.