Data VisualizationVisualization in WordPress - Complete Guide
In this course, we bring to you the most easiest way to create charts and graphs in WordPress. We’ll cover creating static and dynamic charts. Creating charts from Database (Local/Remote), Google sheet, Firebase, and more.
Charts from Multiple Data sources like Google sheets, API and more
Course contentcontent
Preview
video Title
Video
Duration
Part 1 - What Is Data Visualization? Why Is It Important And How It Is Used
Graphically representing the data can be simply termed as data visualization. Enhance your regular text, numbers, figures, and content to communicate data and concepts better with your readers.
3:51
Part 2 - Top 3 Data Visualization WordPress Plugins To Download This Year
Elementor Dynamic Charts Graphs and Datatables plugin empowers you to create data visualizations in WordPress templates by adding data manually or by importing it from external sources.
3:37
Part 3 - Easiest Way To Implement Data Visualization In WordPress Without Any Coding Skills
Graphina is a WordPress data visualization plugin built to help you create various charts and graphs on your website without any additional coding knowledge.
17:56
Part 4 - Dynamic Data In WordPress and its Benefits
The video tutorial displays information on what is dynamic data, the benefits of using this type of data, the application of dynamic data in real-life cases, types of data sources.
5:57
Part 5 - Create WordPress Charts From Google Sheets
Check out the video tutorial for the easiest hack to create WordPress charts using Graphina – Elementor Dynamic Charts Graphs and Datatables plugin.
2:19
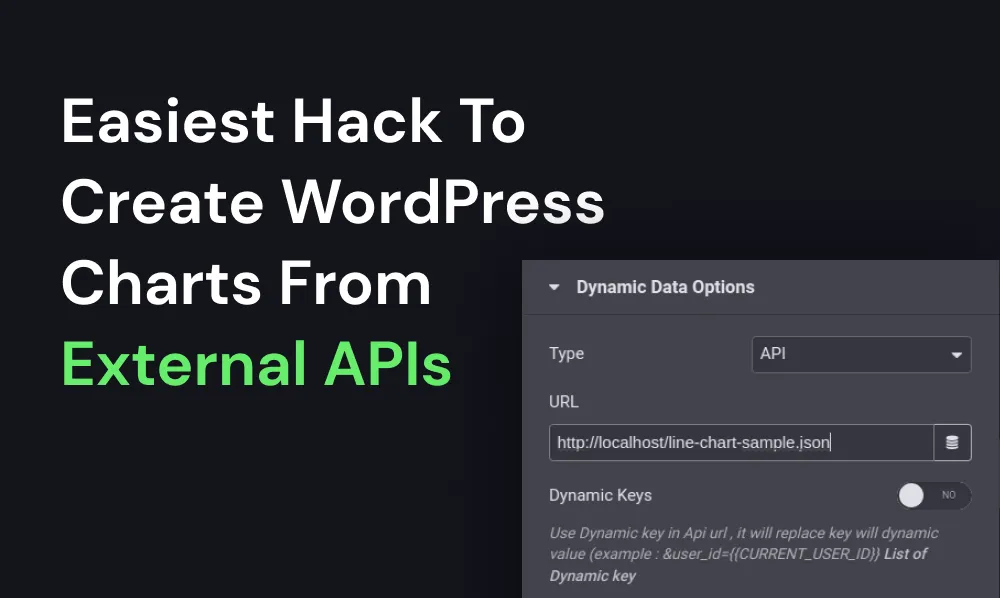
Part 6 - Create WordPress Charts From External APIs [EXCLUSIVE]
Create responsive Charts and Graphs from external APIs with Graphina – Elementor Dynamic Charts Graphs and Datatables plugin.
Create many different chart types like pie charts, bar graphs, line charts.
1:47
Part 7 - Create WordPress Charts From Database MYSQL
Essentially designed to let you process large amounts of data and turn them into WordPress graphs, this Graphina tutorial will share the quickest way to add WordPress Charts From Database using MySQL.
2:12
Part 8 - Create WordPress Charts From CSV File in 2 Mins
In this video tutorial we have shared concept of using CSV file data in transforming data into WordPress tables. Import data for creating WordPress Tables and WordPress graphs using Graphina Pro – Elementor Dynamic Charts, Graphs and Datatables plugin.
1:45
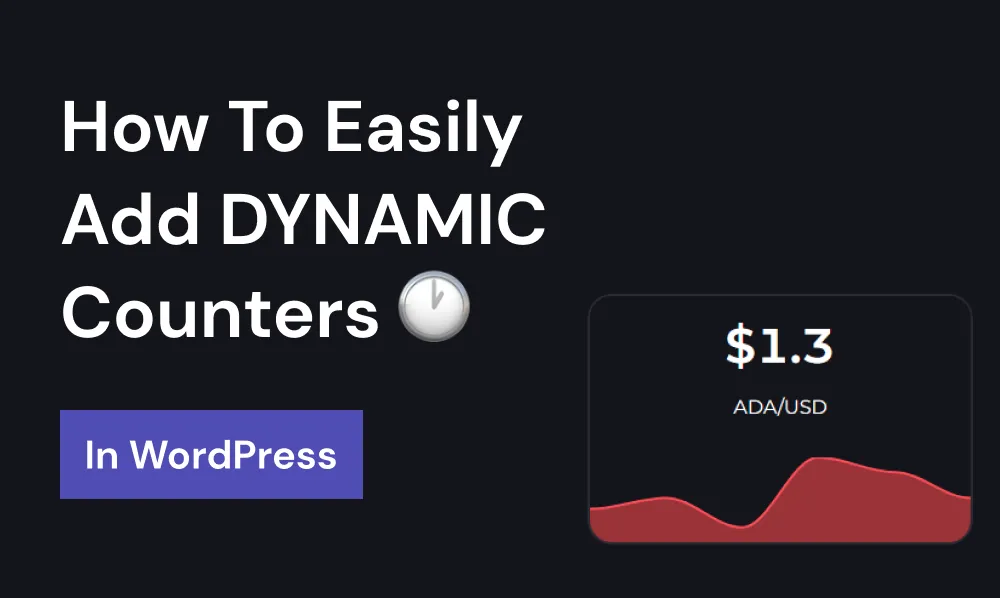
Part 9 - Add Dynamic Counters In WordPress
Adding multiple counters is extremely easy with Graphina – Elementor Dynamic Charts, Graphs, and Datatable plugins. In this tutorial, we have shared how you can convert static counters to dynamic counters by simply adding the data and selecting the counter from the massive Graphina library.
1:40
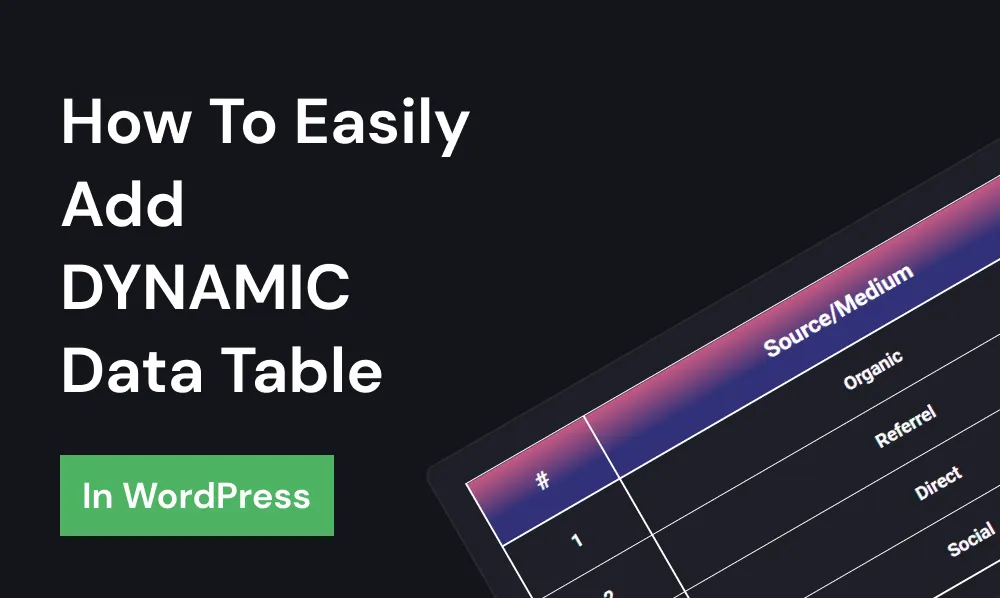
Part 10 - Add Dynamic Datatable In WordPress
In this tutorial, we have shared a quick guide on how you can easily add dynamic Datatable in WordPress using Graphina Pro – Elementor Dynamic harts Graphs and Datatables plugin.
1:33
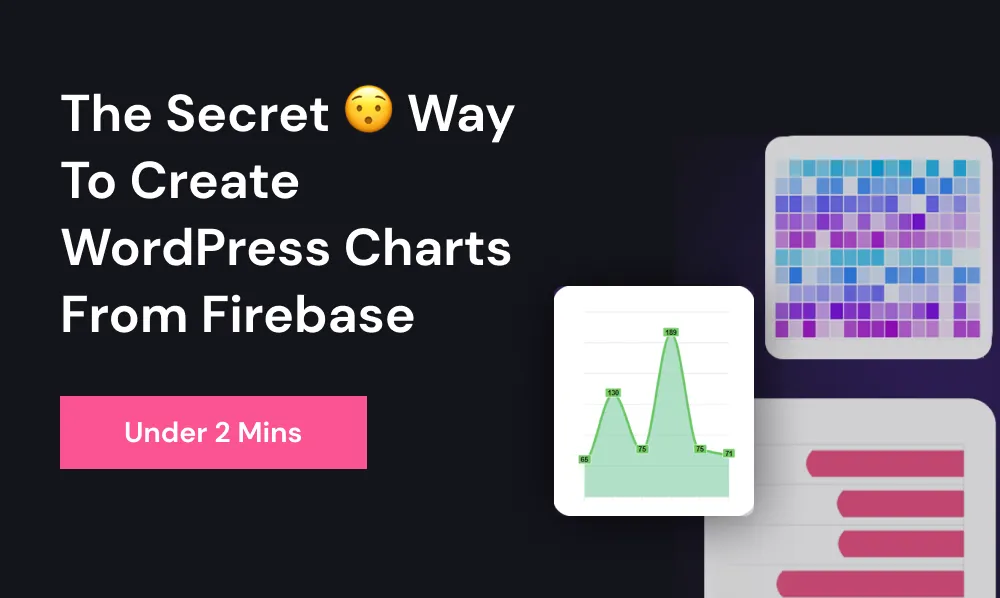
Part 11 - Create WordPress Charts From Firebase [EXCLUSIVE]
In this tutorial, we will share the hidden gem feature of this Dynamic Elementor Charts, Graphs, and Datatables plugin Graphina.
Now you can create WordPress Charts and WordPress graphs right from the Firebase in literally few clicks.
2:51
Part 12 - Privacy in Data Visualization Using Graphina Pro
In this tutorial, we have shared how you can add security and restrictions based on various User IDs on these fully responsive and dynamic WordPress charts and WordPress graphs with GraphinaPro.
5:22
Requirements
Basics of WordPress
Creating pages with ELEMENTOR page builder
No Coding Knowledge required
Created by IQONICIQONIC Design
This course is created by team IQONIC – experts, young, & dynamic creators for WordPress ecosystem. We are trusted by the most thriving developers community of over 100K individuals and businesses firmly focused on empowering other creators with digital products.
Bring Your Vision To Life By Hiring A Results-Driven Team Of Experts.